WORKSHOP SUMMARY

While visualization research is still largely focused on data analysis, most people experience visualization as communication and presentation. The New York Times and other publications regularly release interactive visuals depicting complex datasets including political topics, budgets, and sports. An independent community of visualization practitioners and bloggers has also sprung up, producing and deconstructing visualizations of data of broad interest. Free visualization tools such as D3, Data Wrapper, Tableau Public, and others are available and widely used.

The VisComm workshop brings together practitioners and researchers from a broad range of disciplines to address questions raised by visualization’s new communicative role. We encourage participation from journalists, designers and others that do not typically attend IEEE Vis.

DATE, TIME AND ONLINE ACCESS

The workshop will be held remotely and online on Sunday, October 25, 12pm to 3:30pm MDT (Salt Lake time, or 18-2130 UTC). To tranlate this into your local time, we suggest this time converter.

Attendance and viewing of the workshop are free. To attend, use these links:

We're having a more social VisComm meetup this Thursday Oct 29th @ 15:40 – 16:40 GMT-04:00! You can join us using this link.

Join our mailing list/google group! We'll use it for general discussion and updates around visualization for communication.

PROGRAM

VisComm Session 1: Communicating Health (12:00pm - 1:30pm)

Paper: Mapping the Landscape of COVID-19 Crisis Visualizations
Yixuan Zhang, Yifan Sun, Sumit Barua, Enrico Bertini and Andrea G. Parker

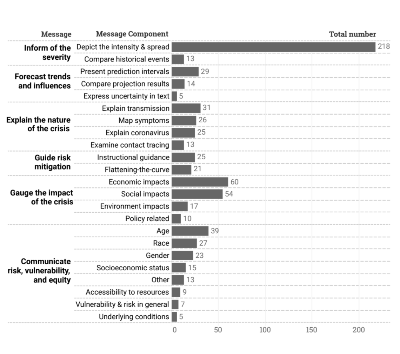
Abstract: A great number of visualizations have been created to communicate the constantly changing crisis of the COVID-19 pandemic. With the prevalence of these crisis visualizations, there is a critical need to organize and understand what and how visualizations have been produced and disseminated....
Visual Case Study: COVID-19 Health Equity Dashboard - Addressing Vulnerable Populations
Star Liu, Dr. Emily Wall, Dr. Shivani A. Patel and Yubin Park

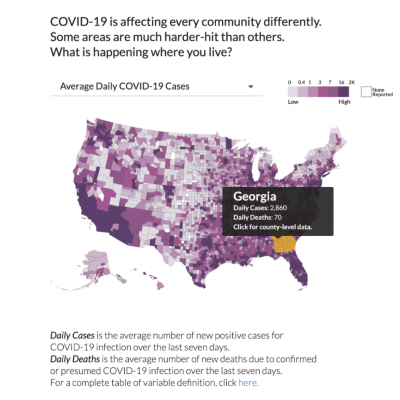
Abstract: We present a case study of the COVID-19 Health Equity Dashboard, an open-source web-based interactive data visualization, that provides timely, localized, and actionable data of the ongoing COVID-19 pandemic. The dashboard features interactive maps and charts alongside population vulnerability characteristics....
Paper: Eating with a Conscience: Toward a Visual and Contextual Nutrition Facts Label
Darius Coelho, Helen He, Maxim Baduk and Klaus Mueller

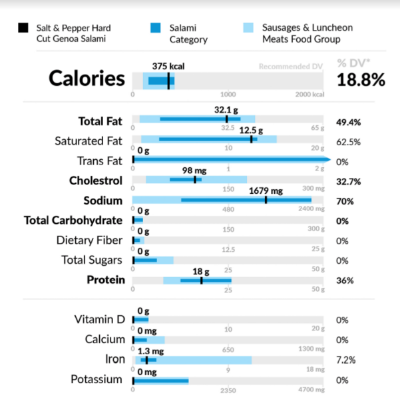
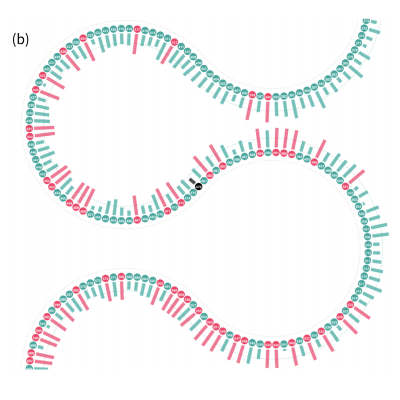
Abstract: The large variety of food products available in today’s market is making it increasingly difficult for the diet-conscious consumer to select the appropriate foods to maintain a balanced diet. To assist consumers, we design a visual nutrition facts label that provides the viewer with a quick overview of a food’s....
Paper: Making Numbers Meaningful – improving how we communicate numbers to patients and the public
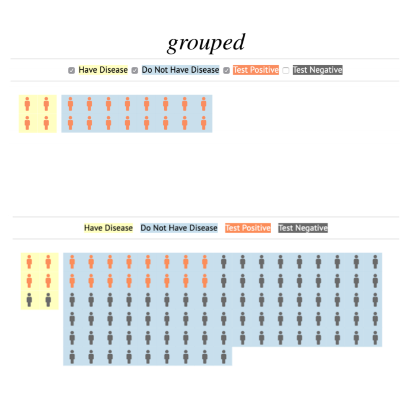
Dr. Natalie Benda, Brian Zikmund-Fisher, Mohit Manoj Sharma and Jessica Ancker

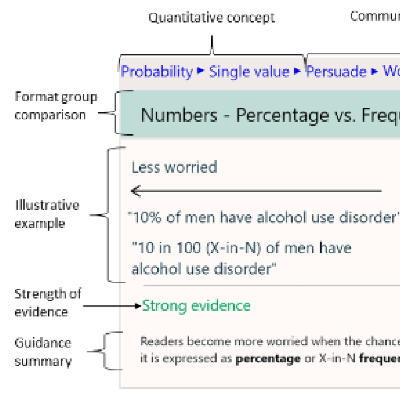
Abstract: Numbers are a crucial piece of visual communication of health-related information. There are currently multiple resources for communicating health-related information in plain language, but an equivalent resource for numeric information....
Visual Case Study: Customized visualizations for audience-oriented communication in COVID-19 tracking story
Liuhuaying Yang, Hui Cheng Ang and Shuyang Wang

Abstract: This visual case study was conducted by zaobao.sg, the digital platform of the Chinese dailies in Singapore. In early February, to inform and communicate with local audiences about the COVID-19 situation in Singapore, we built an interactive....
Paper: Does Interaction Improve Bayesian Reasoning with Visualization?
Ab Mosca, Alvitta Ottley and Remco Chang

Abstract: Interaction enables users to effectively navigate large amounts of data, supports cognitive processing, and increases methods of data representation. However, beyond popular beliefs, there have been few attempts to empirically demonstrate whether adding interaction to a static visualization improves its function....

Break (1:30pm - 2:00pm)

VisComm Session 2: Public, Weather and Other Communication (2:00pm - 3:30pm)

Paper: Variable Biases: A Study of Scientists’ Interpretation of Plot Types Commonly Used in Scientific Communication
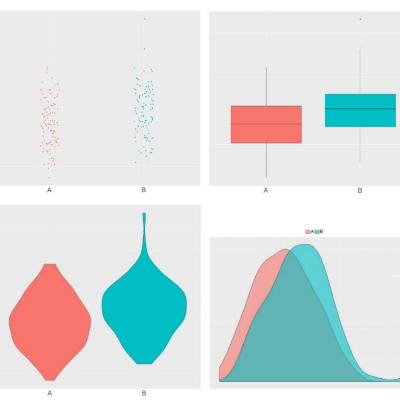
Laura Matzen, Kristin Divis, Michael Haass and Dr. Deborah Cronin

Abstract: In scientific communication, there are visualization conventions that are widely used to convey uncertainty, such as representing the variability of a dataset with error bars. Yet prior research indicates that scientists frequently misinterpret error bars....
Visual Case Study: How do taxes, benefits and public spending evolve for a taxpayer during their lifetime?
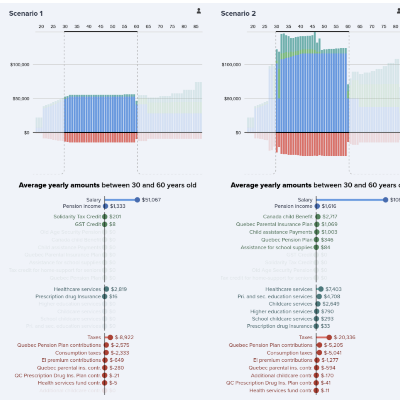
François Lévesque, Luc Godbout, Michaël Robert-Angers and Thomas Hurtut

Abstract: We present a visual case study conducted by the Research Chair in Taxation and Public Finance from Sherbrooke University, visually designed and developed in collaboration with Polytechnique Montreal. How do taxes, benefits and public....
Paper: Applying Racial Equity Awareness in Data Visualization
Jonathan Schwabish and Alice Feng

Abstract: A data visualization style guide does for graphs what the Chicago Manual of Style does for English grammar: it defines the components of a graph and their proper, consistent use. At the Urban Institute, a nonprofit research institution based in Washington, DC, our data visualization style guide....
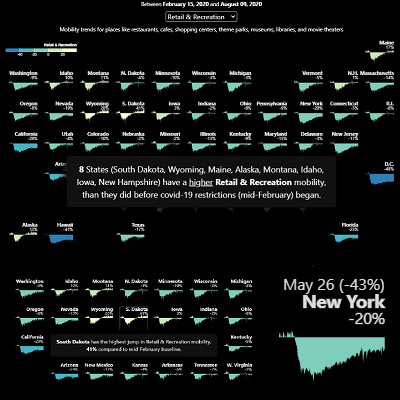
Visual Case Study: Tile Narrative: Scrollytelling with Grid Maps
Pratap Vardhan

Abstract: This visual case study was built to study the effectiveness of scrollytelling in tandem with tile grid maps. Specifically, we built this interactive based on Google’s Community Mobility data measuring people’s movement before and during the COVID-19 pandemic. We designed a dynamic and interactive....
Paper: Position: Visual Sentences: Definitions and Applications
Mark Livingston and Derek Brock

Abstract: Visual forms of communication are ubiquitous in media, educational texts, government reports, and scientific publications. Two challenges immediately come to mind and drive the research agenda we have been following. We need to know that these graphs are provably understandable. We also need to know that the personnel....
Visual Case Study: Analyzing Dorian Twitter data to understand how hurricane risk communication changes as threats unfold
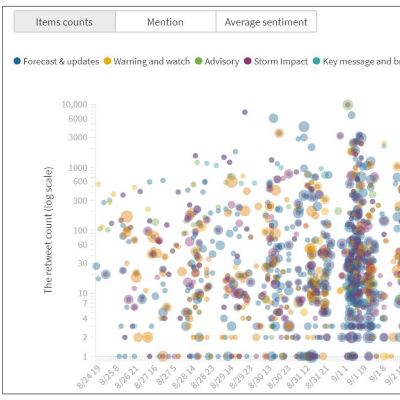
Qian Ma and Barbara Millet

Abstract: This research explores diffusion of forecast messages on social media for Hurricane Dorian (2019) to understand how hurricane risk information is created, disseminated, and discussed in many-to-many communication modes. We....
Paper: Beautiful Visualizations Slain by Ugly Facts: Redesigning the National Hurricane Center’s ‘Cone of Uncertainty’ Map
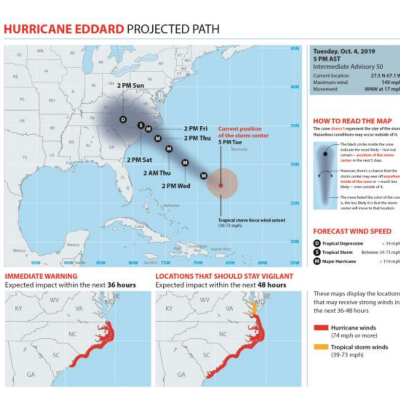
Barbara Millet, Alberto Cairo, Sharanya J. Majumdar, Carolina Diaz, Scotney D. Evans and Kenneth Broad

Abstract: The Track Forecast Cone, commonly known as the “cone of uncertainty”, is the most popular hurricane and tropical storm forecast product that the National....

SUBMISSIONS

VisComm has four submission tracks: short papers (research or position), posters, and visual case studies.

Short Research Papers

Research papers between 2 and 6 pages long, with length matching content. Research papers will be reviewed based on how well claims are supported by evidence. Submissions are expected to include all materials and data needed to replicate and reproduce any figures, analyses, and methods. If anything cannot be publicly shared (e.g., for data privacy concerns), state the reason in the paper.

Short Position Papers

We invite submission of position papers between 2 and 6 pages long, with length matching content. Position papers are problem discussions or statements describing the author’s relevant experience and ideas with regards to methods and methodologies for visualization research, and in particular the focus topic of the workshop. Position papers will be selected according to their importance and relevance for the workshop topics and how well they will fit the planned discussions.

Posters

We invite both late-breaking work and contributions in this area in the form of extended abstracts one to two pages in length (plus an additional page for references), with an optional video.

Visual Case Studies

We invite practitioners to submit a one-page write-up together with a link to an online piece or a short video. The write-up should explain what you made, why you made it, outcome/responses (both expected and unexpected), etc.

The goal is to show the work of journalists, designers, people working for governments or non-profits, etc., who use data to inform and communicate.

IMPORTANT DATES

deadlines occur at 11:59 PM in the last timezone on Earth.

Submission deadline: June 15 July 16 July 23, 2020

Notification: July 15 August 17, 2020

Camera-ready deadline: August 15 August 27, 2020

Speaker schedule available: October 1, 2020

Workshop: Sunday, October 25, 2020

ORGANIZERS

The quickest way to contact VisComm's organizers is via their shared email, viscomm_chairs@googlegroups.com

Alvitta Ottley, Washington University in St. Louis (alvitta@wustl.edu)

Adriana Arcia, Columbia University (aa2594@cumc.columbia.edu)

Ben Watson, North Carolina State University (bwatson@ncsu.edu)

Robert Kosara, Tableau Research (rkosara@tableau.com)

ARCHIVE

2019 schedule, papers and posters

2018 schedule, papers and posters