WORKSHOP SUMMARY
Date and Location: The workshop will be held on Sunday, October 20, 9am to 12:20pm
at IEEE VIS in the Vancouver Convention Centre East Building.
While visualization research is still largely focused on data analysis, most people experience visualization
as communication and presentation. The New York Times and other publications regularly release interactive visuals
depicting complex datasets including political topics, budgets, and sports. An independent community of visualization
practitioners and bloggers has also sprung up, producing and deconstructing visualizations of data of broad interest.
Free visualization tools such as D3, Data Wrapper, Tableau Public, and others are available and widely used.
The VisComm workshop brings together practitioners and researchers from a broad range of disciplines to address
questions raised by visualization’s new communicative role. We encourage participation from journalists, designers
and others that do not typically attend IEEE Vis.
PROGRAM
VisComm Session 1: Visualization for Specific Audiences (9:00am - 10:30am)
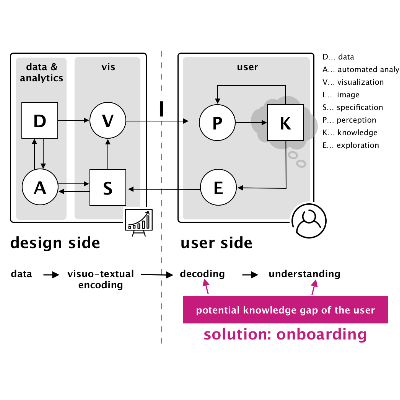
Visualization Onboarding: Learning how to Read and Use Visualizations
Christina Stoiber, Florian-Gregor Grassinger, Margit Pohl, Holger Stitz, Marc Streit, and Wolfgang Aigner
Paper
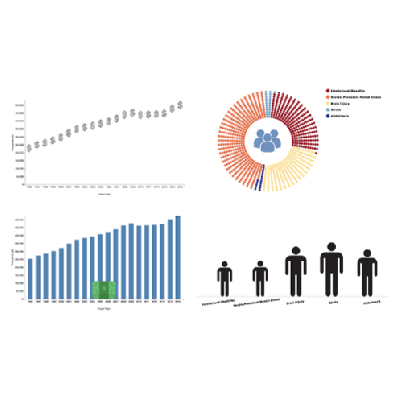
Designing Communicative Visualization for People with Intellectual Developmental Disabilities
Keke Wu, Shea Tanis, and Danielle Albers Szafir
Paper
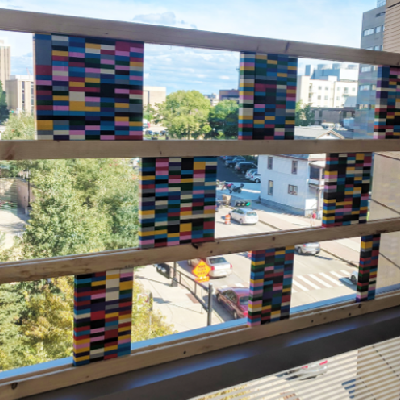
LEGO as Language for Visual Communication
Stuart Flack, Kevin Ponto, Travis Tangen, and Karen Schloss
Visual Case Study
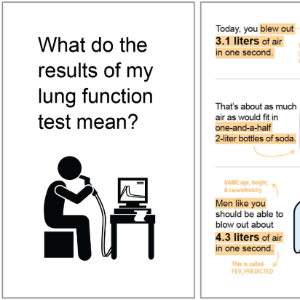
Colors and Imagery in Tailored Infographics for Communicating Health Information to Patients and Research Participants
Adriana Arcia
Poster
Break (10:30am - 10:50am)
VisComm Session 2: Visualization for Communication & Journalism (10:50am - 12:20pm)
Visual Communication and Heuristics: Challenges and Directions from Across the Disciplines
David Berube
Paper
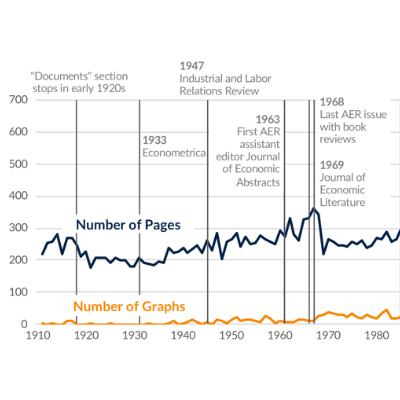
Categorizing and Ranking Graphs in the American Economic Review Over the Last Century
Jon Schwabish
Paper
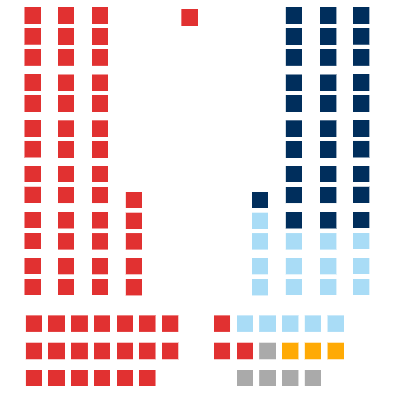
Data Visualization + Scrollytelling for Election News Stories : Challenges and Perspectives
by Jean-Philippe Corbeil, Florent Daudens and Thomas Hurtut
Visual Case Study
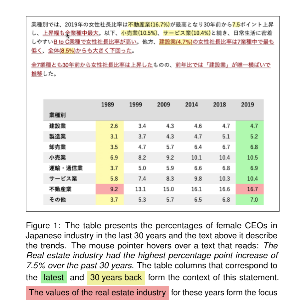
Guiding the Reader to Statistical Focus and Context of Industrial News Reports
by Ken Wakita and Kohei Arimoto
Poster
A Visualization Course for Journalism Students
by Stefan Jänicke
Poster
Accepted, but not Presented
A study of Production and Consumption of Information Graphics in Indian Regional Newspapers
by Udayan Vidyanta and Venkatesh Rajamanickam
Paper
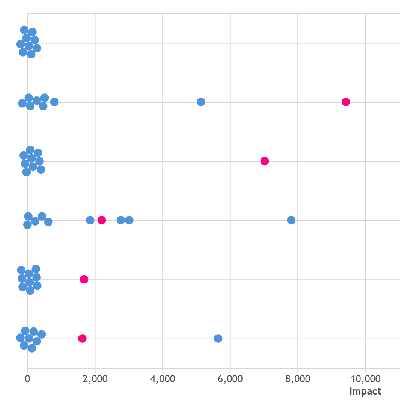
Creating a Buzz around Corporate Reputation with Beeswarm Plots
by Iain Dillingham and Aoife McCarthy
Visual Case Study
Vernacular Visualization Practices
Jaime Snyder
Poster
SUBMISSIONS
VisComm has four submission tracks: short papers (research or position), posters, and visual case studies.
Short Research Papers
Research papers between 2 and 6 pages long, with length matching content. Research papers will be reviewed
based on how well claims are supported by evidence. Submissions are expected to include all materials and data
needed to replicate and reproduce any figures, analyses, and methods. If anything cannot be publicly shared (e.g.,
for data privacy concerns), state the reason in the paper.
Short Position Papers
We invite submission of position papers between 2 and 6 pages long, with length matching content. Position papers
are problem discussions or statements describing the author’s relevant experience and ideas with regards to methods
and methodologies for visualization research, and in particular the focus topic of the workshop. Position papers will
be selected according to their importance and relevance for the workshop topics and how well they will fit the planned
discussions.
Posters
We invite both late-breaking work and contributions in this area in the form of extended abstracts one to two
pages in length (plus an additional page for references), with an optional video.
Visual Case Studies
We invite practitioners to submit a one-page write-up together with a link to an online piece or a short video.
The write-up should explain what you made, why you made it, outcome/responses (both expected and unexpected), etc.
The goal is to show the work of journalists, designers, people working for governments or non-profits, etc., who
use data to inform and communicate.
IMPORTANT DATES
deadlines occur at 11:59 PM in the last timezone on Earth.
Paper submission deadline: June 15, 2019 extended to July 15th, 2019
Paper notification: August 1, 2019
Paper camera-ready deadline: August 15, 2019
Poster & case study submission deadline: September 6, 2019
Poster & case study notification: September 13, 2019
Poster & case study camera-ready deadline: September 27, 2019
Speaker schedule available: October 1, 2019
Workshop: Sunday, October 20, 2019
ORGANIZERS
Steve Haroz, Inria (viscomm@steveharoz.com)
Noeska Smit, University of Bergen (noeska.smit@uib.no)
Ben Watson, North Carolina State University (bwatson@ncsu.edu)
Robert Kosara, Tableau Research (rkosara@tableau.com)